Objectives
The goal of this lab was to utilize various raster geoprocessing tools to build models to find sand mining suitability and risks to the environment and community of Trempealaeu County, WI. This was done in three parts: First, I must create a suitability model from newly created spatial layers for mining criteria such as geology, land use cover, distance to roads, slope, and water depth. This model will show prime locations for sand mining. Second, I need to create a risk model mapping the potential environmental and community impacts from sand mining. Lastly, I must overlay the two models to determine the best locations for sand mines in Trempealaeu County, WI. in which optimal conditions for sand mining and minimal environmental and community risk met.
Data sets used in this lab come from the Trempealeau County Land Records Division Website and from the National Land Cover Dataset gathered from the NLCD website.
Methods
There are three sections of this lab in which I 1. create a suitability model for stuitable mining land, 2. create a risk model for mapping potential impacts to the environment and community, and 3. Combine the models to determine the best locations for sand mines.
To create the suitability model, I first created several spatial layers. The first of these layers was geology. In Wisconsin, the Cambrian Jordan (Ej) and Wonewoc (Ew) sandstone types are the most ideal frac sands because of their grain size and sorting. Therefore, after converting the geology feature class into a raster using the Feature To Raster conversion tool, I reclassed the raster values to rank these layers as most important (Table 1) (Fig. 1). All feature classes for all spatial layers were projected into the NAD 1983 Wisconsin (US Feet) coordinate system and clipped to the study area within Trempealeau County before any other tools were run.
 |
| Fig. 1: ModelBuilder process for creating the geology spatial layer. |
 |
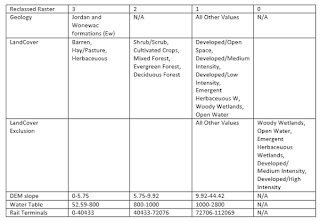
Table 1: Reclassification of values for spatial layers used to build the Suitability Model.
3 is most important, 0 is excluded.
|
A landcover spatial layer was created using NLCD2011 features. I used the Polygon to Raster conversion tool to create a raster that would give me values showing type of land cover. I then reclassed the values twice: once for most suitable land cover types and another for excluding land cover types completely incapable of housing sand mines (Fig. 2). For the first reclassification, I deemed Hay/Pasture and Herbaceauous as "most important," or most suitable for mining as this land is not developed and requires little clearing for building a mine in the area. Values classified as "2" were landcover types that were not developed but required some clearing before a mine could be built. Landcover types reclassed as a 1 were areas of development, areas requiring significant clearing before building, and areas completely unsuitable for mining such as areas containing water. The exclusion reclassification excluded all areas containing water and developed areas having relatively high percentages of urban or residential development (Table 1).
 |
| Fig. 2: ModelBuilder process for creating reclassified landcover layers. |
Proximity to rail terminals was found by utilizing the Euclidean Distance tool. Then, the resulting values from the Euclidean Distance output was reclassified to show higher suitability in areas closer to terminals than farther (Table 1) (Fig. 3).
 |
| Fig. 3: ModelBuilder process for creating spatial layer with distance from rail terminals. |
Slopes can effect the suitability of mine land. To find slopes, I first used the Extract By Mask tool to clip a USGS DEM of Tremealeau County to the study area within Trempealeau County. After, slope degrees were found by running the Slope tool and Block Statistics were applied to smooth out the resulting raster. The output was then reclassified to rank the most gentle slopes as most suitable and the steepest slopes as unsuitable (Table 1) (Fig. 4).
 |
| Fig. 4: ModelBuilder process to create the slope spatial layer. |
For the last spatial layer used to build a suitability model, I looked at the water table depth. To do this, water table elevation contours from water table feature class was converted to a raster then reclassified so greater depth of the water table was given the rank of "most important" (Table 1)(Fig. 5).
 |
| Fig. 5: Water table elevation converted to raster then reclassified using ModelBuilder. |
Using Raster Calculator, All 5 spatial layers were combined by multiplying each resulting raster together in a mathematical expression. This created the Suitability Model for land most suitable for frac sand mining. The resulting model gave cell values with the highest values being considered the most suitable for frac sand mines.
To create a risk model, I followed the same steps for creating a suitability model and created 5 spatial layers from features of the environment and community that frac sand mining could potentially affect. For this model, however, reclassification values were scored as 3 being the highest impact and 1 being the least impact (Table 2).
 |
| Table 2: Reclassified values for spatial layers used to build an Environmental and Community Risk Model. 3 is considered high impact values and 1 is considered low impact values. |
My first spatial layer was proximity to streams. Since so many streams are present in Trempealeau County and if all streams were considered for the environmental impacts, all possible mine locations would be too close to a stream and would be considered to have high environmental impacts. For this reason, I chose one type of stream I found most important to the environment and that mine impacts could have the most effect on. Perennial Streams were chosen as this stream as they have constant flow an presence in the area. The Euclidean Distance tool was used to determine distance from the perennial streams and Reclassify was used to rank areas closest to the stream as high impact and areas furthest away as low impact (Table 2) (Fig. 6).
 |
| Fig. 6: Modelbuilder process to create a spatial layer for proximity to streams. |
 |
| Fig. 7: ModelBuilder process for creating farm land spatial layer. |
The third spatial layer was created to find distance from residential areas as noise pollution, air pollution, and traffic can be a concern for residents living near by. Euclidean Distance was used to find proximity to residential zones in a zonation feature class and the result was reclassified to rank closer proximity as high impact areas (Table 2) (Fig. 8).
 |
| Fig. 8; ModelBuilder process to create a spatial layer for proximity to residential areas. |
School districts were not included in residential zones and may also be impacted by the effects of noise and air pollution as well as traffic. I created a spatial layer to find proximity from school districts by first creating an SQL statement to find all land parcels that were owned by a school district. I then used Euclidean Distance and Reclassify to find proximity and rank the areas closest to school districts as high impact areas (Table 2) (Fig. 9).
The last spatial layer looked at proximity to Wildlife areas because the noise and air pollution can affect the animals within these designated regions and can be considered a nuisance to anyone hiking or exploring these areas. Euclidean Distance was used to find proximity and Reclassify was used to rank areas closest to wildlife regions as high impact areas (Table 2) (Fig. 10).
An environmental and community risk model was created using Raster Calculator by multiplying all 5 spatial layers with a mathematical expression. High values indicate high risk areas. To further examine any impacts, a viewshed was created to determine if any possible mine locations could be seen from an area of importance of value. I chose High Cliff Park as it is a tourist destination for its beauty and outdoor recreation. I converted the polygon border of High Cliff Park to a Raster then converted this Raster to Point Data with the center of the polygon expressed as a point. I then added this into the Viewshed tool and used the suitability model as locations of interest (Fig. 11).
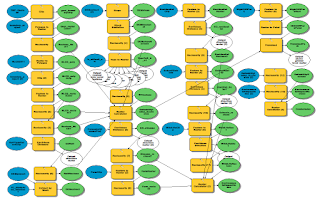
I then reclassified the environmental risk model and the suitability model and combined these outputs to find a model for the best locations suited for frac sand mines (Fig. 12). The entire process can be seen in Figure 13. I also used PyScripter to create a Best Locations model in which streams were more important than all other factors. The script can be seen under "Script 3" in my Python Scripts page.
Spatial Layer outputs from the model builder process used to create a Suitability Model for suitable frac sand mine land. Criteria include proper geology, Land Cover (excluding completely unusable land such as the types with standing water), Land Cover Type, proximity to rail terminals, gentle slopes, and water table depth. Figure 14 shows all outputs, Table 1 is shown below again to reference values.
A complete Suitability Model displays the suitability of the land in the study area within Trempealeau County, Wisconsin. This was created by a raster calculator mathematical expression in which all land suitability criteria spatial layers were multiplied together (Fig. 15).
Potential Environmental and Community Impacts Spatial Layer Outputs
Spatial layers output for criteria for potential environmental and community impacts associated with frac sand mining. Criteria include potential impacts on perennial streams, prime farmland, residential zones, school districts, and wildlife zones. All potential impacts are taken from proximity measurements from the criteria as they are all important environmental and community aspects. Figure 16 shows all spatial layer outputs and Table 2 is shown again for reference of distance rankings for each criterion.
A complete Environmental and Community Risk Model was created in raster calculator with a mathematical expression multiplying all 5 criteria (Fig. 17).
Best Locations
The Suitability Model and the Environmental and Community Risk model were combined to create an index of Best Locations to place potential future Frac Sand Mines in Trempealeau County, Wisconsin (Fig. 18).
Viewshed Analysis
Suitable mine locations viewable from Hill Cliff Park (Fig. 19).
 |
| Fig. 9: ModelBuilder process to find proximity from schools and rank areas within close proximity to schools as high impact regions. |
The last spatial layer looked at proximity to Wildlife areas because the noise and air pollution can affect the animals within these designated regions and can be considered a nuisance to anyone hiking or exploring these areas. Euclidean Distance was used to find proximity and Reclassify was used to rank areas closest to wildlife regions as high impact areas (Table 2) (Fig. 10).
 |
| Fig. 10: ModelBuilder process to designate close proximity to Wildlife areas as high impact and areas farther from Wildlife areas as low impact regions. |
 |
| Fig. 11: Using Viewshed to determine if suitable mine locations could be seen from High Cliff Park. |
I then reclassified the environmental risk model and the suitability model and combined these outputs to find a model for the best locations suited for frac sand mines (Fig. 12). The entire process can be seen in Figure 13. I also used PyScripter to create a Best Locations model in which streams were more important than all other factors. The script can be seen under "Script 3" in my Python Scripts page.
 |
| Fig. 12: ModelBuilder process to reclass and combine suitable land and environmental risk models into a model displaying the best locations for frac sand mines. |
 |
| Fig. 13: Creating a suitability model and environmental and community risk model in one flow model in ModelBuilder. |
Results
Land Suitability Criteria Spatial Layers Output
Spatial Layer outputs from the model builder process used to create a Suitability Model for suitable frac sand mine land. Criteria include proper geology, Land Cover (excluding completely unusable land such as the types with standing water), Land Cover Type, proximity to rail terminals, gentle slopes, and water table depth. Figure 14 shows all outputs, Table 1 is shown below again to reference values.
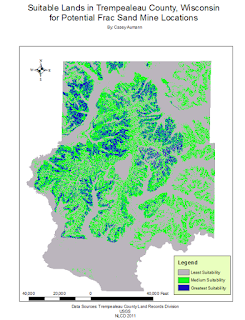
A complete Suitability Model displays the suitability of the land in the study area within Trempealeau County, Wisconsin. This was created by a raster calculator mathematical expression in which all land suitability criteria spatial layers were multiplied together (Fig. 15).
 |
| Table 1: Reclassification of Suitability Criteria Spatial Layers where 3= Most Suitable, 2= Medium Suitability, 1= Low Suitability, and 0= Exclusion. |
 |
| Fig. 14: Land Suitability Criteria outputs for Frac Sand Mine Locations in Trempealeau County, Wisconsin. |
 |
| Fig. 15: Completed Suitability Model created from all 6 Suitable Land spatial layer criteria. |
Spatial layers output for criteria for potential environmental and community impacts associated with frac sand mining. Criteria include potential impacts on perennial streams, prime farmland, residential zones, school districts, and wildlife zones. All potential impacts are taken from proximity measurements from the criteria as they are all important environmental and community aspects. Figure 16 shows all spatial layer outputs and Table 2 is shown again for reference of distance rankings for each criterion.
A complete Environmental and Community Risk Model was created in raster calculator with a mathematical expression multiplying all 5 criteria (Fig. 17).
 |
| Table 2: Reclassifications of values for each spatial layer used to create an Environmental and Community Risk Model where 3= high impact, 2= medium impact, and 1= low impact. |
 |
| Fig. 16: All 5 environmental and community criteria that are potentially impacted by Frac Sand Mines. Maps display low, medium, and high potential impacts for each of the 5 criteria. |
 |
Fig. 17: Environmental and Community Risk Model using all 5 spatial layers created from the
environmental and community criteria.
|
The Suitability Model and the Environmental and Community Risk model were combined to create an index of Best Locations to place potential future Frac Sand Mines in Trempealeau County, Wisconsin (Fig. 18).
 |
| Fig. 18: Best Frac Sand Mine Locations with the least environmental and community impacts and most suitable land criteria where 1=least optimal and 6= most optimal. |
Viewshed Analysis
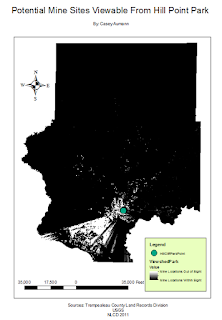
Suitable mine locations viewable from Hill Cliff Park (Fig. 19).
 |
| Fig. 19: Suitable mine locations able to be seen from Hill Cliff Park. |
Discussion
The suitability model shows much of the suitable lands for potential future frac sand mines are within the middle to northern portion of Trempealeau County. These are areas that contain ideal sandstone types, exclude all wetland and areas with standing water, areas with more gentler slopes, and areas in which the water table is relatively closer to the land surface.
The risk model shows that much of the area in Trempealeau County is a risk to environmental and community factors. There are only small areas of land in which frac sand mines would not be as much a risk to residential zones, school districts, wildlife zones, prime farmland, and perennial streams.
The Best Locations index shows areas of Trempealeau county with the least amount of environmental and community impacts and the highest level of land suiability given all of the criteria investigated during this activity. Much of the land in Trempealeau County is ill-advised for use for frac sand mines. It would be advised to only build future frac sand mines in the designated locations mapped in Figure 18 with the highest ranking.
According to the viewshed analysis, much of the suitable mine locations are within view from Hill Cliff Park, a popular tourist attraction in Trempealeau County. Some of the least suitable land for mines is out of sight from Hill Cliff Park. This makes building frac sand mines in suitable locations difficult if it is of high importance to hide it from sight from Hill Cliff Park.
According to the viewshed analysis, much of the suitable mine locations are within view from Hill Cliff Park, a popular tourist attraction in Trempealeau County. Some of the least suitable land for mines is out of sight from Hill Cliff Park. This makes building frac sand mines in suitable locations difficult if it is of high importance to hide it from sight from Hill Cliff Park.
Conclusion
During this activity, I created multiple spatial layers in ModelBuilder by utilizing conversion and spatial anylist tools. I was able to created suitability and risk models as well as a combined suitability and risk index for frac sand mine locations utilizing raster calculator in map algebra tools and even experimented with viewshed to see if potential best locations for mines could be seen from a popular park attraction. This activity was important for practicing setting up risk and suitability assessments that can be used for future projects such as estimating potential threats to an endangered species or finding best locations for structures designed to boost ecosystem biodiversity.
Sources:
For Travel Information and Parks in Trempealeau County: http://www.travelwisconsin.com/southwest/trempealeau-county/galesville
Trempealeau County Land Record's Division Website for Water Table Elevation Data: https://wgnhs.uwex.edu/pubs/000444/
No comments:
Post a Comment